
Fact sheet Deployment of ferries
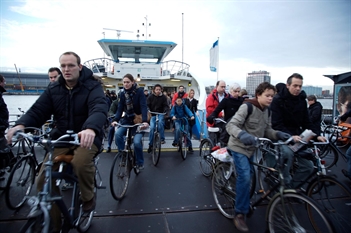
Ferries are regularly used as a temporary measure in the event of road works, especially when bridges and tunnels are closed. By enabling the transport of cyclists, pedestrians and public transport (buses), ferries contribute to direct local accessibility and to reducing the congestion on alternative (detour) routes.
In principle, the temporary deployment of a ferry does not attract many new cyclists or public transport users, and is intended more to reduce barriers. However, the case study of the extra ferry during the Velser tunnel closures shows that extra use of a ferry can also lead to a substantial modal shift in specific cases.
Accessibility effects
Little can be said about the accessibility effects of ferries in general. The use of an extra ferry during the renovation of the Velser tunnel (see Velser Ferry case study) showed that in some cases about 1,600 extra cyclists were attracted per day. In this case, there was a 40% increase in use compared with/in addition to the number of users on the existing ferry.
The deployment of the Velser ferry was part of a larger package of measures to reduce disruption resulting from work on the Velser tunnel. The package resulted in a total of around 1,000 instances of rush-hour avoidance per day. However, it was not clear how many of these instances could be ascribed to the deployment of the extra ferry.
An extra rush-hour ferry was also deployed during the closure of the A10 West (summer 2017). This extra ferry between the Hempontplein and Zaandam halved the waiting time and was mainly used by the greatly increased number of cyclists, partly due to cycling stimulation measures. Here too, it was difficult to distinguish the effects of the individual measures that together formed one package.
Sustainability effects
In order to identify the sustainability effects of ferries, we assumed a complete switch from car to bike by people avoiding the rush hour. We also assumed an average travel distance of five kilometres.
| CO₂ | NOx | PM₁₀ |
|---|---|---|
| 1.1 | 0.0013 | 0.00015 |
Variables with an impact on effects
The context in which the measure is implemented is important (long detours by bicycle, many traffic jams in the region, road works), combined with various incentive measures by employers, for example.
A higher frequency in ferry crossings makes this mode of transport more attractive to users, as it reduces the maximum waiting time. Clarity about departure times (e.g. via an app) also contributes to reliable travel times, and thus influences the effects.
Marketing and communication are also factors that influence the effects. After all, motorists must be 'tempted' to leave their cars at home and use their bicycle, and therefore the bicycle ferry as well. Transport by water must be optimally linked to other modes of transport and facilities, so that people can travel quickly and comfortably. The needs of travellers, such as taking their bikes with them and fast transfers, must therefore be the main focus during implementation. This means, for example, that the boats must moor within a few minutes' walking distance of metro stations, tram and bus stops, and train stations.
Costs (including VAT)
In the case of structural deployment of a foot passenger-bicycle ferry, the average cost per passenger is €9.13. The bandwidth here ranges from €3.31 to €13.38. With a public transport fare, the cost recovery does not exceed forty to fifty per cent. The remaining part of the costs must be supplemented by a contribution from public funds. For the Waterbus in Rotterdam, for example, an hour's transport costs €250. The deployment of an extra ferry in the case of road works on the A10 costs €180 per hour.
There are several factors that affect the cost:
- For the local authorities, there are also costs for the mooring points for the boats, including the connecting infrastructure. These costs are not incurred when using an extra ferry alongside an existing ferry.
- Rental costs, fuel costs and personnel costs.
Sources consulted
- Bereikbaarheidsplan Renovatie Velsertunnel: van tegenstand tot medestand! Taner et al (2016) – http://www.nationaalverkeerskundecongres.nl/Uploads/2016/9/16-Artikel-Velsertunnel-in-NVC-format-definitief.pdf
- Openbaar vervoer, meer dan een verplaatsting van Zaandam naar Amsterdam. Variantenstudie bootverbinding voor openbaar vervoer vaan Zaanstad naar Amsterdam. Afstudeerrapport NOVI verkeersacademie – HBO Verkeerskunde (2013)
- Personenvervoer over Water. Samenhang bestaande voorzieningen en initiatieven voor korte termijn in relatie tot visie langere termijn. Gemeente Rotterdam, 2016
- Snelweg over de Maas. Personenvervoer over water in de Rotterdamse Regio. Economic Development Board Rotterdam (2008)
- Vervoer over water trekt vooral fietsers. Cees Doeser, Grontmij (2011)
- Water: Personenvervoer vaart er wel bij! Provincie Zuid-Holland, MRDH, Gemeente Rotterdam, Drechtsteden & Havenbedrijf Rotterdam (2017)
Rules of thumb
- accessibility effects: possibly several hundred instances of rush-hour avoidance
- effect on sustainability: reduction of 1.1 kg of CO₂ per instance of rush-hour avoidance
- costs: €180-€250 per scheduled service hour