
Fact sheet Cycling infrastructure
The bicycle network can be improved by making routes faster, easier, more attractive, comfortable and/or safer. These improvements will contribute to the satisfaction and safety of today's cyclists and to the Dutch cycling culture.
Improving cycle routes can also boost the use of bicycles and contribute to replacing short car trips with bicycle rides. With the development of fast cycle routes and the growing proportion of electric bikes, the bicycle is also more often seen as an alternative to the car over medium distances. In combination with good bicycle parking facilities at public transport hubs (see the fact sheet Bicycle parking facilities at public transport hubs) a good bicycle network is also an alternative for longer distances.
In order to get more out of the measure, it is advisable to combine it with communication and measures to influence demand, as described in the case study Bicycle infrastructure Rijnwaalpad.
Accessibility effects
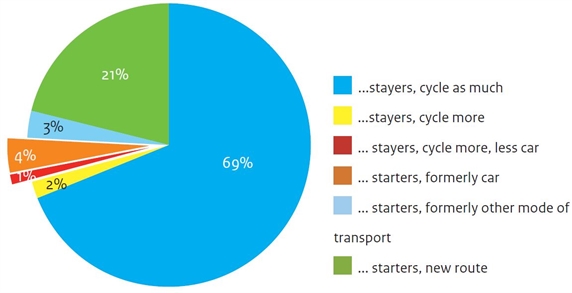
Evaluations of improvements to the bicycle infrastructure show that approximately 2-5% of all cyclists on the improved cycle routes have said that they used to go by car to the same destination. In Dutch cities with a large proportion of bicycles, this means up to 100-200 rush-hour avoidances a day for each improved cycle route. These are relatively short journeys; improving the bicycle infrastructure is therefore less suitable as an alternative to long-distance driving. Most users of improved cycle routes also used to cycle before [1]. This is shown in Figure 1. Nevertheless, recent research [15] shows that the construction of fast cycle routes may tempt car users to switch to cycling. In fact, a fast cycle route makes an average of 50 motorists decide to cycle in the rush-hour.
Sustainability Effects
For replacing a car with a bicycle or e-bike in the rush-hour, we have assumed the average length of a bicycle ride from home to work to be 5 km and the average length of an e-bike ride to be 10 km. The following emissions are saved per rush-hour avoidance:
| CO₂ | NOx | PM10 | |
|---|---|---|---|
| Bicycle | 1.5 | 0.002 | 0.0001 |
| E-bike | 3 | 0.004 | 0.0002 |
Other effects
Evaluations of improved cycle routes show not only a modest change in the choice of mode of transport, but also an increase in the satisfaction of current cyclists. This ensures that cyclists will continue to cycle and possibly even cycle more. And satisfied cyclists are good ambassadors for cycling, which may encourage more people to cycle. This indirect effect is difficult to demonstrate, but it is consistent with results from behavioural research into the major influence of social norms on behaviour. So in the case of measures that influence demand, current cyclists are often used as ambassadors for cycling.
People who cycle regularly are on average ill for1.3 days a year less than non-cyclists [2], and relatively fitter. As a result, they have higher work productivity. However, a causal relationship has not been demonstrated and it is also possible that good health enables people to cycle more often. When the costs and benefits of cycling are expressed in euros per km, it appears that cycling yields a health benefit of €0.39 per km [3]. We can also look at the social effects of travelling one kilometre by bike through the city, compared to the cost of travelling one kilometre by car or bus. This shows that the bicycle scores very well (€0.68/km societal benefits) compared to both car (€0.37/km societal costs) and bus (€0.29/km societal costs) [4].
Variables affecting effects
The location of the improved cycle route obviously has a major influence on the magnitude of the effects. In an urban environment, use will be greater and with it the effects. In addition, it is logical that if previously missing links in the bicycle network - for example a cycling bridge - are filled in, this will lead to more direct cycling routes. This has more effect than applying a new layer of asphalt to an existing cycle path, for example.
The factors influencing the attractiveness of a cycle route in (potential) transitions from car to bicycle are (in order of decreasing importance) [5]:
- the travel time on that cycle route
- the number of interruptions on the route like intersections and traffic lights
- car costs
- the quality of the road surface
- separation of car and bicycle traffic
- lighting on the cycling route
For the travel time on a cycle route it is important not only to look at the objective travel time (clock time), but also the perceived travel time. Recent research shows that cyclists perceive attractive routes as shorter [12]. Making a cycle route more enjoyable can stimulate the transition from the car to the bike. An enjoyable cycle route can feel more pleasant and shorter than a car ride that may take less time in practice, but is much less enjoyable.
Short car trips are best suited to be replaced by bicycle rides. An investment on a 7.5 km cycle route has five times more effect than the same investment on a 15 km route [3]. With the rise of the e-bike, distance is becoming less important, but also for the e-bike motorists are tempted more easily by distances of up to 7.5 km.
For maximum effect, it is important to focus on health effects in communication. This is the most frequently mentioned reason to cycle more. A restrictive parking policy also considerably increases the effects of improvements in cycling infrastructure.
Although investing in cycling infrastructure has several positive effects, it is also important to consider the downside of all developments related to cycling. Crowding on cycle paths and the diversity of users are increasing, and the emergence of e-bikes is increasing speed differences. Now more than half of all road injuries in the Netherlands result from a bicycle accident without the involvement of a motor vehicle. And this number continues to rise. Older cyclists have an increased risk of these accidents. On the one hand, they can cycle longer (partly due to the rise of the e-bike), which is good for their mobility and vitality. On the other hand, this increases the proportion of vulnerable road users, which is also expected to increase the number of cycling accidents.
We now know that a good cycling infrastructure reduces the number of accidents. Sufficient width, a shoulder that fits well to the paved surface, edge marking, good ice-control measures in winter and the fewest possible obstacles such as bollards reduce the risk of unsafe situations and the consequences of any conflicts/accidents. These kinds of design principles make our cycle paths safer, both for the young and the older cyclist. The complete prevention of accidents does not only depend on a good cycling infrastructure. The behaviour of the cyclist and behavioural measures always play an important role, of course.
Costs (including VAT)
Projects for which costs were available show a variation in investment costs between €150,000 and a couple of million euros. There are therefore many different improvements possible to the cycling infrastructure, each with its own price tag.
Based on a new separate cycle path with a width of 3.5 m, the construction costs per metre are on average €717. These costs include process, construction and property costs. The bandwidth ranges from €268 to €1,046, with costs higher for weak subsurfaces and within built-up areas.
In a general sense, however, the total annual costs for infrastructure can be considered. Annually the infrastructure for a bicycle costs €0.03 per km, which is considerably lower than the costs for car, bus and train infrastructure [4], see table.
| Modality | Annual cost per traveller's kilometre | Annual cost per inhabitant (17 million inhabitants) |
|---|---|---|
| Bicycle | €0.03 | €33 |
| Car | €0.10 | €342 |
| Bus | €0.14 | €26 |
| Train | €0.18 | €133 |
More information
See www.wegwijs-beterbenutten.nl/fiets
Sources consulted
- ‘Met de fiets minder file’ Vooral een succesvolle lobby (Fietsverkeer 26, 2010)
- Fietsen is groen, gezond en voordelig (TNO, 2010)
- Maatschappelijke kosten en baten van de fiets. Quick scan (Decisio, Transaction Management Centre, 2012)
- Decisio (2016) Maatschappelijke Waarde en Investeringsagenda Fietsen Verantwoordingsrapportage - http://tourdeforce2020.nl/wp-content/uploads/2017/04/Verantwoordingsrapportage.pdf
- Evaluatie Fietsfilevrij (MuConsult, 2010)
- Factsheet Kostenkentallen Snelfietsroute (MuConsult, 2014)
- Factsheet Beter Benutten F35 (Beter Benutten regio Twente, 2015)
- Monitoring en evaluatie fietsmaatregelen Midden-Nederland en thema fiets (Beter Benutten, 2015)
- Eindrapport Gebruikersonderzoek Vleutensebaan (Goudappel, 2017)
- Interventions in bicycle infrastructure, lessons from Dutch and Danish cases (Van Goeverden et al. in Transportation Research Procedia, 2015)
- Effects of upgrading to cycle highways - An analysis of demand induction, use patterns and satisfaction before and after (Hans Skov-Petersen et al. in Journal of Transport Geography, 2017)
- Onderzoek reistijdbeleving fietsers (Goudappel Coffeng, 2018)
- Bouwstenen voor een comfortabel en vergevingsgezind fietspad (Den Brinker en Schepers, 2018)
- Fietsfeiten (KiM, 2018)
- Gebruikersonderzoek snelfietsroutes Gelderland (2018)
Rules of thumb
- effect on accessibility: maximum 100-200 rush-hour avoidances per day in cities and approximately 100 on fast cycle routes
- effect on sustainability: reduction of 1.5 (bicycle) to 3.0 (e-bike) kg CO2 per rush-hour avoidance
- costs: dependent on concrete measures